Visualize a Databricks WKT/WKB column with Lonboard

(or any Spark DataFrame WKT/WKB column)
You might store geospatial data in a Spark DataFrame as a string, in well-known text (WKT), (or as binary, in well-known binary, WKB). Here is a way to directly visualize a sample of it in lonboard.
The below was tested on Databricks, but should be possible in any pyspark environment.
Prerequisites
%pip install lonboard geopandas shapely --quiet
The viz function
def spark_wkt_viz(df, wkt_column="wkt_geometry", limit=10_000):
    # needs `%pip install lonboard geopandas shapely`

    import geopandas as gpd
    from lonboard import viz
    from shapely import wkt

    pdf = df.limit(limit).toPandas()
    pdf[wkt_column] = pdf[wkt_column].apply(wkt.loads)
    gdf = gpd.GeoDataFrame(pdf, geometry=wkt_column)
    return viz(gdf).as_html()
You can write the a WKB version just as well by replacing every wkt instance with wkb:
def spark_wkb_viz(df, wkb_column="wkb_geometry", limit=10_000):
    # needs `%pip install lonboard geopandas shapely`

    import geopandas as gpd
    from lonboard import viz
    from shapely import wkb

    pdf = df.limit(limit).toPandas()
    pdf[wkb_column] = pdf[wkb_column].apply(wkb.loads)
    gdf = gpd.GeoDataFrame(pdf, geometry=wkb_column)
    return viz(gdf).as_html()
Example on a sample dataset
In [ ]:
from pyspark.sql import functions as F

df = spark.range(3).withColumn(
    "wkt_geometry",
    F.concat(F.lit("POINT("), F.col("id"), F.lit(" "), F.col("id"), F.lit(")")),
)

spark_wkt_viz(df, "wkt_geometry")
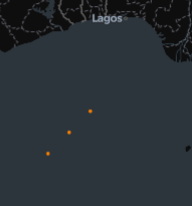
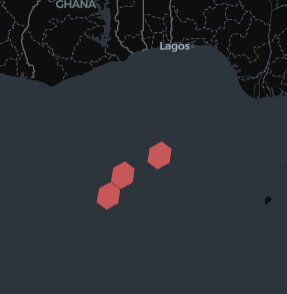
This might look a bit underwheliming, so let's add a WKB example as well – note that to generate some WKB, the Databricks H3 functions are used, but should work just as well work for any WKB.
from pyspark.databricks.sql import functions as dbf

df = spark.range(3).withColumn(
    "wkb_geometry", dbf.h3_boundaryaswkb(dbf.h3_longlatash3("id", "id", 3))
)

spark_wkb_viz(df, "wkb_geometry")
Or even better, using some Overture Maps data as example:
df = spark.read.parquet("s3://overturemaps-us-west-2/release/2025-05-21.0/theme=transportation/type=segment/")

spark_wkb_viz(df, "geometry")

(As this dataset is larger than our limit, your actual output will be different, based on the arbitrary sampling of the data.)